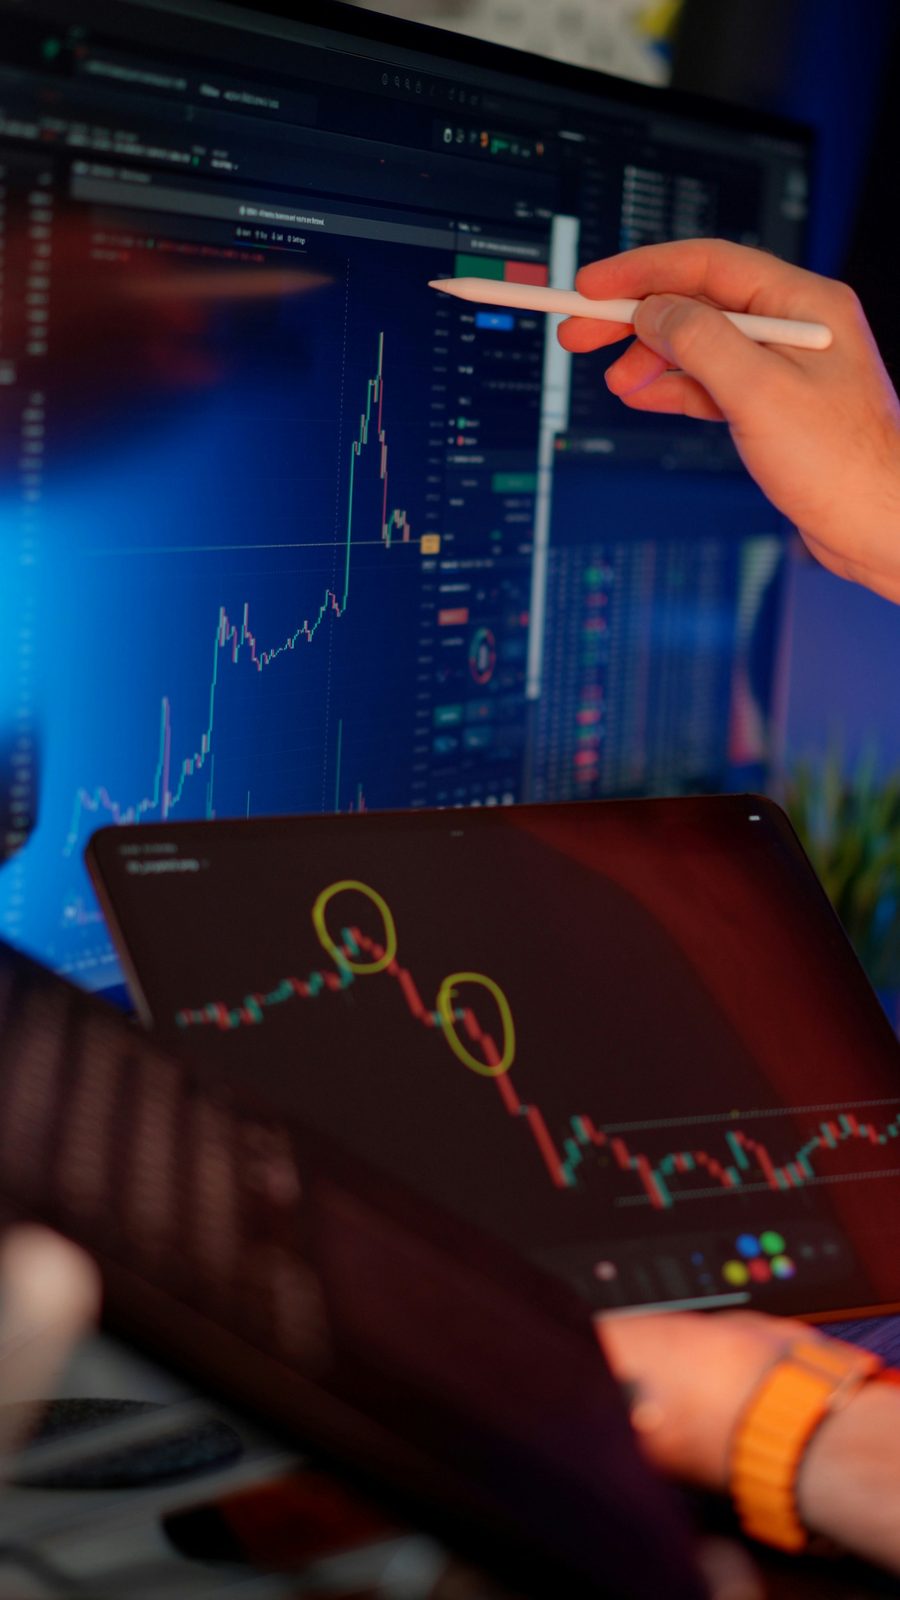
ZEUS Vision reads years of price history with neural-network models and projects where Bitcoin, Ethereum and 500+ pairs are heading next — five moving averages at once, drawn straight onto the chart.
Crypto never closes. Prices move while you sleep, and by the time a move is obvious on a chart, most of it has already happened.
ZEUS Vision is a forecasting tool built for that problem. It takes the price history of a pair, runs it through models trained on how markets actually behave, and projects the next leg of the trend — not as a label, but as lines drawn forward on the chart where you can judge them yourself.
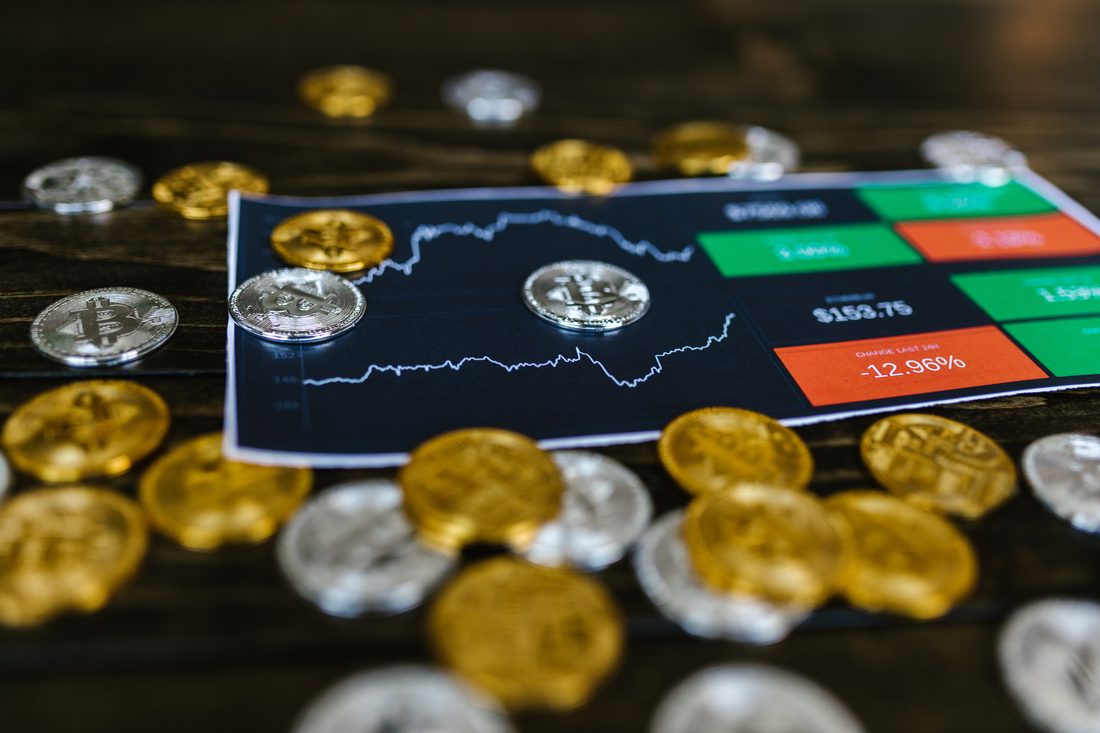
LIVE MARKETS
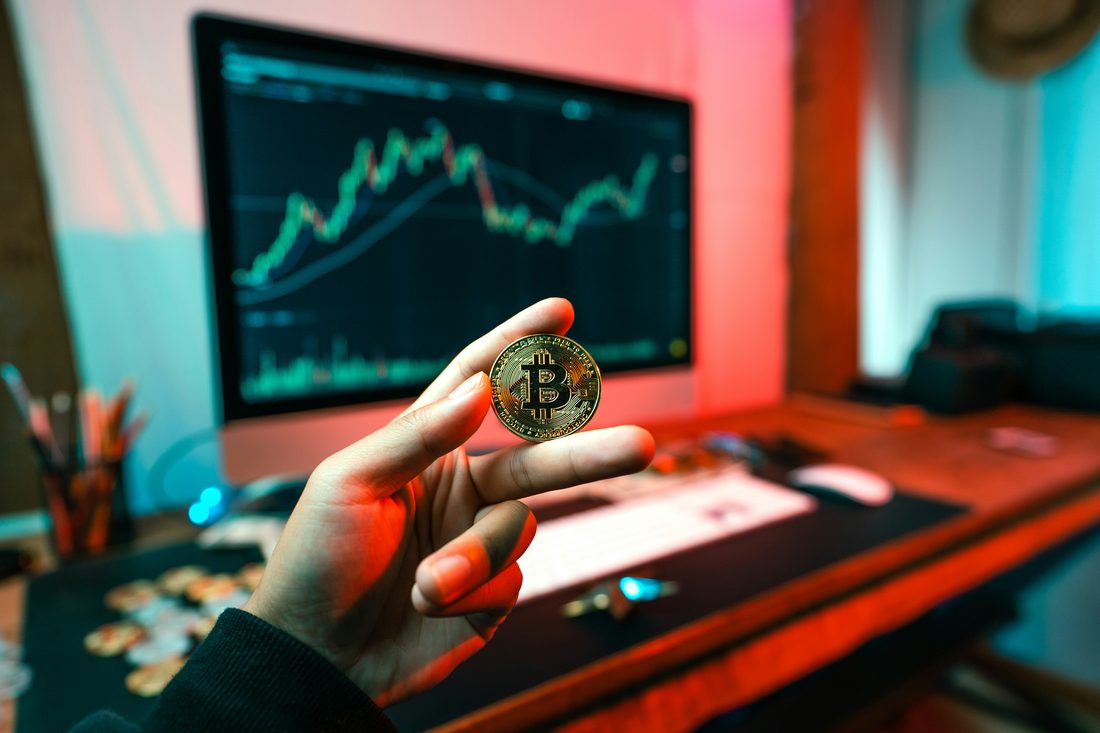
THE LONG VIEW
Serious forecasting tools have always been pointed at institutions — expensive terminals, closed models, answers you are expected to trust without seeing the working.
We think an individual trader deserves the same quality of analysis, shown openly enough to argue with. That is the whole idea behind ZEUS Vision.
Four things we hold ourselves to.
LONG-TERM GROWTH
What crypto offers that traditional markets do not — and why that makes forecasting worth having.
No opening bell, no weekend gap. Markets run continuously, which means more data and more opportunities — but also no natural point to stop watching.
Every trade is public. That transparency is what makes statistical forecasting possible here in a way it rarely is elsewhere.
No broker approval, no minimum account size. Anyone can participate — which is exactly why good analysis matters so much.
MAJOR ASSETS
RESEARCH ONLY
ZEUS Vision never holds your coins, never asks for exchange keys, and never places a trade. There is nothing here to hack and nothing to withdraw.
It is the research layer you consult before you open your exchange. You keep custody, you keep control, and you make the decision.
Signing in gives us an email address and nothing more. No wallet connection, no seed phrase, no API keys — if anyone ever asks you for those in our name, it is not us.
Every forecast projects five moving averages at once. When the fast averages push above the slow ones, that is a bullish structure forming; when they roll beneath, momentum is turning.
Intraday timeframes and swing timeframes use different models, chosen automatically when you pick the interval.
READING THE MOVE
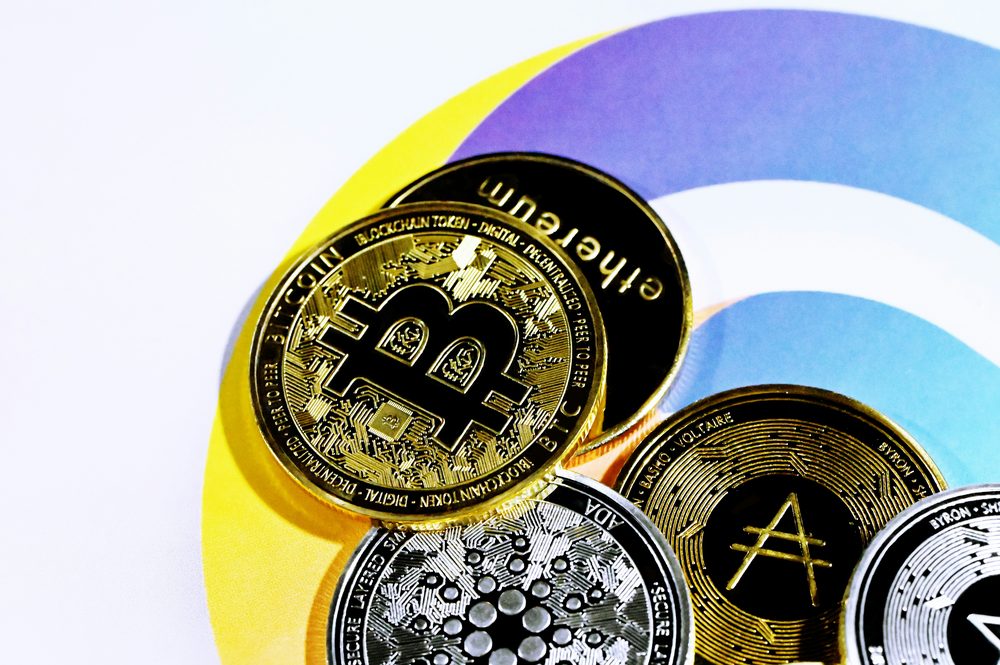
DIGITAL ASSETS
Digital assets have moved from curiosity to a market institutions now hold on their balance sheets. Settlement that once took days clears in minutes, and it runs every hour of the year.
Whatever you make of that shift, it produces something unusual: a continuous, public record of how millions of people price risk. That record is what our models learn from.
Three charts side by side on one screen. Compare three coins, or the same coin across three timeframes, without losing your place.
GLOBAL MARKETS
Four reasons traders keep the tab open.
You see the projected lines drawn forward on the chart, with their spread. No black-box "BUY" badge asking to be trusted.
A one-minute chart and a daily chart behave nothing alike. We route them to different trained models rather than forcing one to do both.
Real forecasts on real pairs without a card. Upgrade when the limit starts getting in your way, not before.
No wallet connection and no exchange API keys, ever. Sign-in is an email address and nothing else.
BUILT FOR TRADERS

Sign in with Google and you land straight on the dashboard — pick a pair, pick a timeframe, and watch the AI project the next leg of the trend. No card, no setup.